Recreating classic computer art with p5js.

History
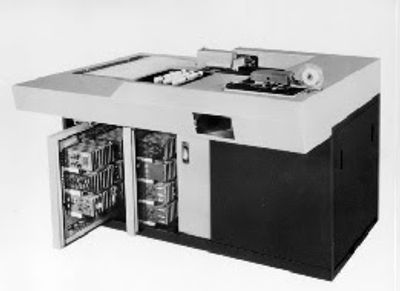
Georg Nees pioneered the field of computer generated art. While working at Siemens, he used a Zuse Z64 industrial plotter to create "something useless [sic]", starting a long and ongoing tradition of engineers making their company financially support their hobby.
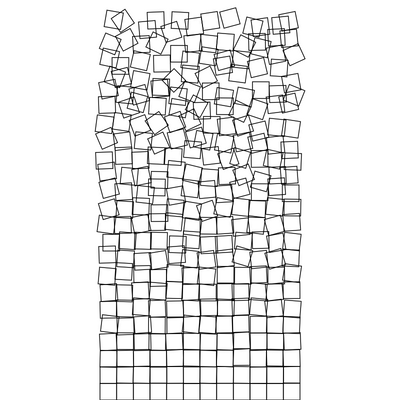
From 1965's ComputerGraphik exhibition onward, he showcased groundbreaking artwork, such as Schotter (1968) we will recreate here.
From chaos only, order can be born. And vice versa.
Prerequisites
To avoid tedious coordinates calculations, we will be using the following methods from p5js library:
- normal
- rectMode normal
- translate normal
- push/pop normal
- randomGaussian
Instead of calculating each square’s coordinates which would result in poorly readable code, we will use the push/pop methods and perform transformations before drawing our squares.
Algorithm
Create a grid, following these steps:
- normal
- draw N number of squares horizontally for a given width normal
- offset towards bottom of screen by one square height normal
- back to step 1. until the bottom of screen is reached
Each square's rotation, X and Y coordinates, are offset by a random amount, proportional to its Y position on the screen.
Calling rectMode(CENTER) beforehand, transformations are applied from the center of the square, not the top-left corner as it is by default. we apply an offset of half a square so they all get rendered on-screen.
Order
Let’s start by initializing our canvas, rectMode, and background.
function setup() {
  createCanvas(800, 800);
  rectMode(CENTER);
  background(255);
}
and draw a series of squares occupying the whole width.
function setup() {
  createCanvas(800, 800);
  rectMode(CENTER);

  background(255);

  const resX = 12; // number of squares per line
  const w = width / resX; // dimension of a square

  translate(w * 0.5, w * 0.5); // offset by half a square

  for (let i = 0; i < resX; i++) {
    square(0, 0, w);
    translate(w, 0);
  }
}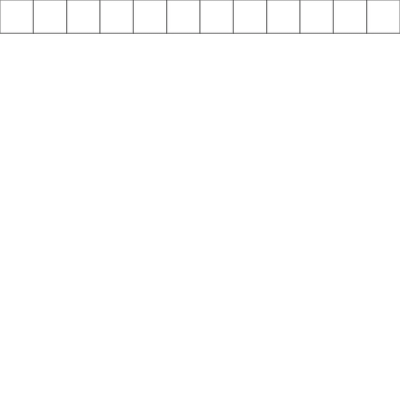
Notice how drawing a square at coordinates (0, 0) after calling translate effectively produces a square at the right position: the reference position we are drawing at is shifted to the right by one square’s width, each iteration...
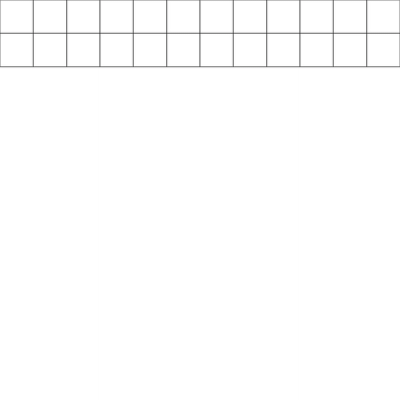
To draw a new line of squares under the previous one, this reference position needs to be reset to its previous value. That’s what push and pop methods are used for.
Let’s surround our previous code with another loop and run it a couple of times… And let’s apply a new transformation, this time vertically.
...
for (let j = 0; j < 2; j++) {
  push();

  for (let i = 0; i < resX; i++) {
    square(0, 0, w);
    translate(w, 0);
  }

  pop();
  translate(0, w);
}
...
- normal
- Calling push stores the initial transformation’s state. normal
- Transformations are applied. normal
- Calling pop restore reference point to its previous state.
The call to translate in the outer loop shifts the reference position one square towards the bottom. All transformations after that are applied from that position.
To cover our screen with squares, let’s use a while loop and break it when the bottom of the screen is reached.
...
let y = 0;

while (y + w < height) {
  push();

  for (let i = 0; i < resX; i++) {
    square(0, 0, w);
    translate(w, 0);
  }

  pop();
  translate(0, w);

  y += w;
}
...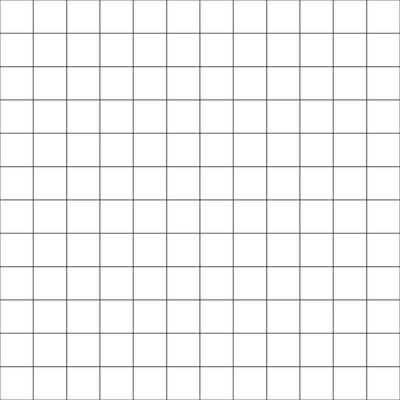
Our grid is ready to be messed with. 🙂
Chaos
Instead of the random method, randomGaussian is used to generate numbers with a normal distribution we can tweak later… First argument is the number values returned are centered around; second argument is how much these values should deviate from the center.
Let’s use it to offset our squares.
...
const d = y / height;

for (let i = 0; i < resX; i++) {
  const dX = d * randomGaussian(0, 0.3);

  push();
  translate(dX * w, 0);
  square(0, 0, w);
  pop();

  translate(w, 0);
}
...
We push the transformation reference point, offset it by a random value, draw our square, then pop back to the previous transformation. This value is proportional to the Y position of the square in the screen.
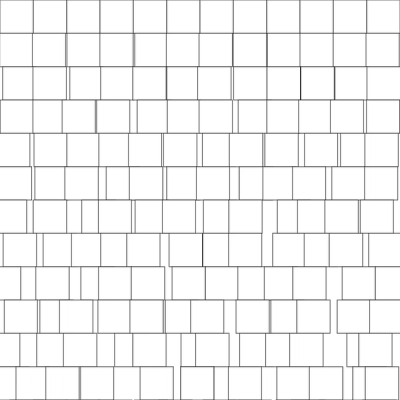
Applying the same principle to Y coordinate and rotation, we get:
...
const d = y / height;

for (let i = 0; i < resX; i++) {
  const dX = d * randomGaussian(0, 0.1);
  const dY = d * randomGaussian(0, 0.1);
  const dR = d * randomGaussian(0, 0.2);

  push();
  translate(dX * w, dY * w);
  rotate(dR * QUARTER_PI);
  square(0, 0, w);
  pop();

  translate(w, 0);
}
...
Getting closer!
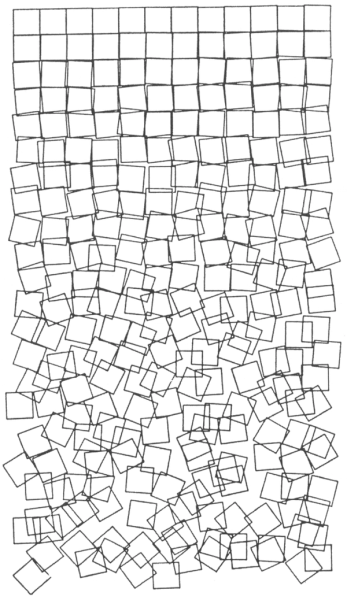
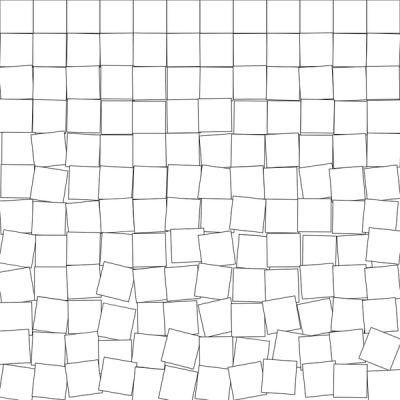
Let’s introduce margin, remove the fill for our squares and tweak the randomness…
function setup() {
  createCanvas(800, 800);
  rectMode(CENTER);

  background(255);
  noFill();
  strokeWeight(1.5);

  const resX = 12;
  const margin = width * 0.25;
  const w = (width - margin * 2) / resX;

  translate(margin + w * 0.5, w * 0.5);

  let y = 0;

  while (y + w < height) {
    const d = y / height;
    push();

    for (let i = 0; i < resX; i++) {
      const dX = d * randomGaussian(0, 0.2);
      const dY = d * randomGaussian(0, 0.3);
      const dR = d * randomGaussian(0, 0.4);

      push();
      translate(dX * w, dY * w);
      rotate(dR * QUARTER_PI);
      square(0, 0, w);
      pop();

      translate(w, 0);
    }

    pop();
    translate(0, w);

    y += w;
  }
}
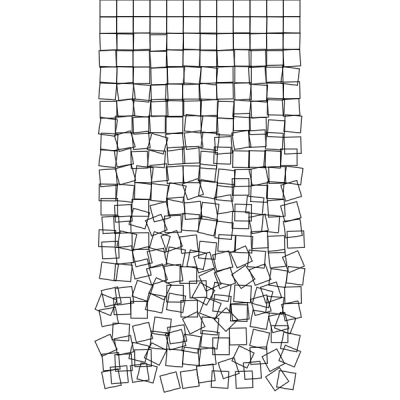
Conclusion
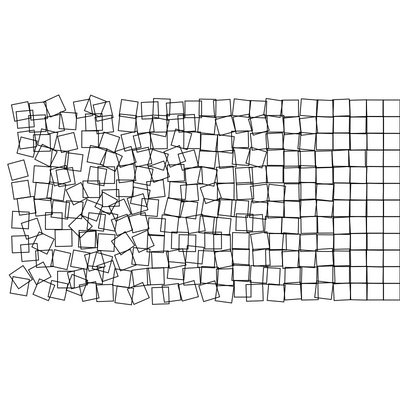
Schotter is both amazing by its simplicity and message. One remarkable thing about this piece, is that its meaning can changed in regard to its orientation: